Template Performance Profiler
In Endevver's experience, when a Movable Type user comes to us saying, "my system is too slow," 99 times out of a 100 we can trace the problem to their templates. You see, Movable Type puts an incredibly powerful templating language into the hands of each one of its users, and so it is not uncommon for a well meaning plugin or template change to result in an unfortunately performance side effect.
Over the years, Endevver has become incredibly adept at diagnosing and fixing virtually any performance problem a Movable Type user may have; and one of the most useful and important tools in our tool belt is a plugin we wrote called the Template Profiler. The plugin allows an administrator to generate a performance report for any template in their system. The report then shows for each template tag used within the template the following statistics:
- The total time spent processing all the calls made to the tag.
- The number of times the tag was called.
- The average time it took to process each tag.
- The number of database queries each tag generated.
- The number of cache hits and misses that occurred while processing the tag.
It presents these statistics in a simple table virtually anyone can read.
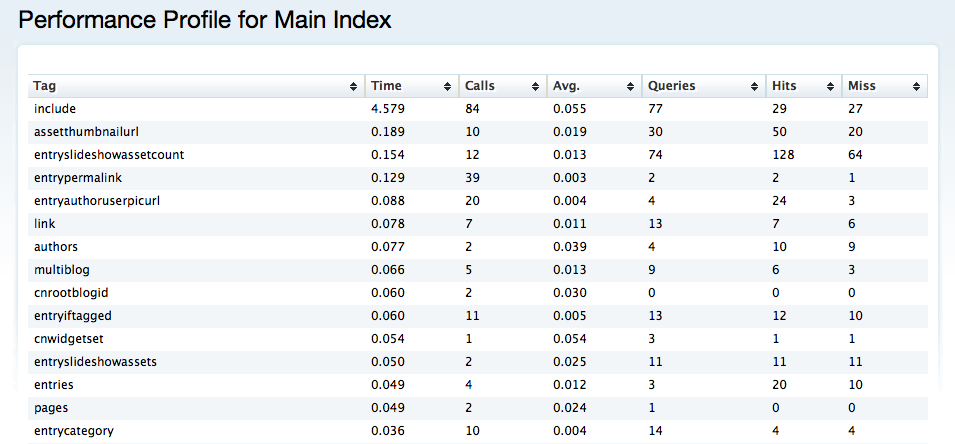
And even if you don't completely understand the terminology at hand it is easy, even for the layman, to spot the outliers and the bottlenecks. With that information at hand, you then are in a much better position to begin addressing the performance issue than ever before.
As with all of our software, we make this tool available to everyone in the Movable Type community under a free and open source license.
Download
The latest version of Template Profiler can always be downloaded directly from github.
Installation
This plugin is installed in a manner similar to every other Movable Type plugin.
Usage
 To generate a performance report select "Templates" from the "Design" menu. Highlight (i.e. click the checkbox of) the template you want to profile, then select "Generate Performance Report" from the list action pull down menu. Finally, click "Go" to view the results.
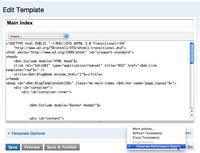
You can do the same from the template editing screen using the template action dropdown menu at the bottom of the screen to the right of the save and publish buttons.
When viewing the results, you may click the column headers to sort the data according to the desired criteria to quickly see - which tag generated the most database queries, which tag was the slowest, etc.
Support
Template Profiler is an open source plugin licensed under the GPLv2 that is supported and maintained by Endevver when we can. Please submit bugs and feature requests to lighthouse.